


History of Bitcoin Cryptomarket Tops
By Dr. Chris Kacher [Hanse Digital Access, KJA Digital Asset Investments and Virtue of Selfish Investing]

By Dr. Chris Kacher [Hanse Digital Access, KJA Digital Asset Investments and Virtue of Selfish Investing]
Quantum Poodles Bringing Billions to Blockchain™

How to Handle Sharp Corrections in Bitcoin
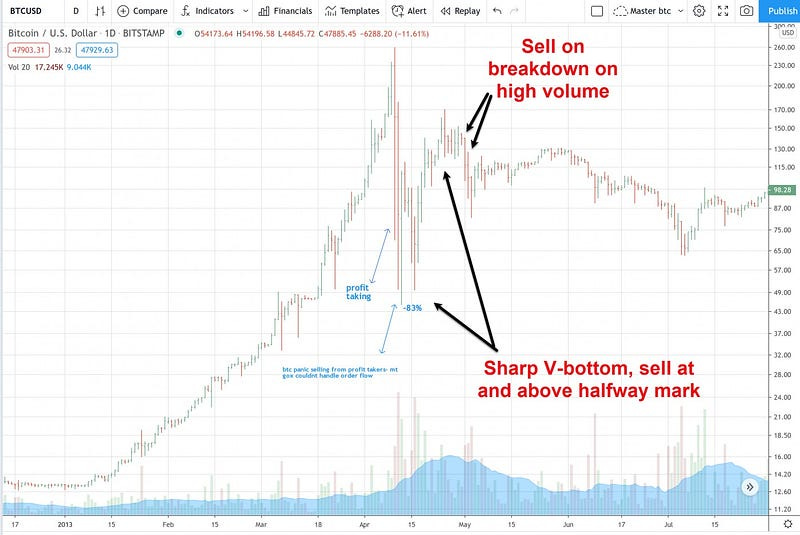
Dollar-cost averaging or pyramiding the leading names during bull cycles can help one sit tight when bitcoin goes through its inevitable 25–40% corrections. We have had two such corrections in bitcoin so far this year. All bubbles rhyme in terms of price/volume action alone. Since the 1990s, I have studied bubbles going back hundreds of years. A few examples include the South Sea Bubble, Dutch tulipmania, the roaring 20s, the dot-com boom, and the prior crypto bubbles in bitcoin and altcoins.
Predicting & Timing Market Tops
By popular demand, many have asked how I handled the major cryptocurrency market tops of 2013 and 2017? My metrics are designed to catch the major tops and bottoms in bitcoin and ethereum to within a few weeks, if not days. They have correctly called every major low and major high in bitcoin to within a few weeks or less in real-time since 2011 (backtested Jan-2011 to Jan-2013, then went live). I have mentioned a number of them in prior reports.
Such metrics include factors such as:
=Price performance of major leading cryptocurrencies that are not BTC nor ETH. As with stocks, tracking the price performance of crypto leaders on a fundamental and technical basis provides much insight into overall buying and selling pressures. Fundamentals include team strength/track record, disruptive potential, competitors, ability to meet milestones, the overall look of website/whitepaper, and so on. Specific data metrics such as TVL (total value locked) applies to companies in the DeFi realm.
=Various technical indicators such as NUPL, Grayscale unlock BTC & ETH being added or subtracted from major exchanges, futures funding rates, on-chain flows, DXY direction, number of active addresses, hash rate, bitcoin market cap: Thermo cap ratio, Puell ratio, and NVT, among others.
A History of Bitcoin Market Tops
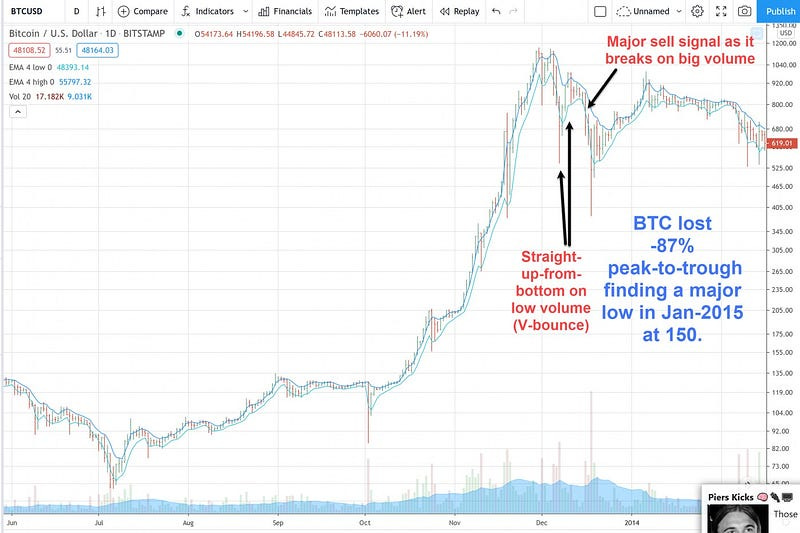
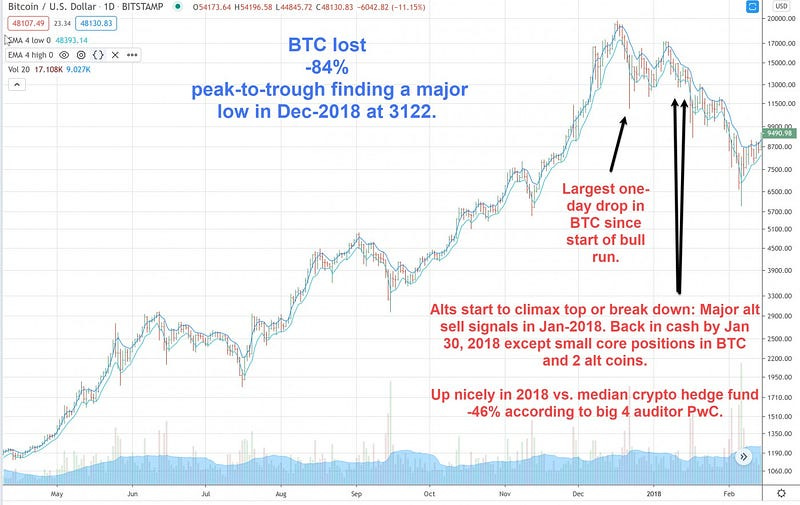
One example of a top in bitcoin came in Dec-2013. As a consequence, the first major sell signal came in Jan-2014 based on my metrics; the second major top came in Jan-2018. Since altcoins heavily correlate with the direction of bitcoin and ethereum, I use directionality in both BTC and ETH to guide my market exposure.
Spring-2013 Market Top
Dec-2013 Market Top
2017–2018 Market Top
To be sure, major tops tend to include heightened levels of volatility and noise after a climax run which tends to be relatively clean as prices soar over the last few weeks or less. In the crypto space, blockchain brings transparency in the form of factually hard data, which tends to correlate to price trends in bitcoin to a high degree. This helps gauge the extent of the bull run as well as ID potential market tops as a cluster of overbought metrics send red alerts near market tops. Of course, change is the only constant when it comes to markets, so odds favor the next market top certainly will not repeat the last but potentially rhyme. Stay tuned.
Check out our new platform 👉 https://thecapital.io/